


By F. Kyriazi (with G. Prokopos)
With the past post on the "Midas Touch", that showed the close relationship between gold and agricultural prices, we thought that there is room for going one step further: constructing a "pseudo" currency index that might emulate the attempt of the BRICS countries to create a new transactional currency that will be commodity-based. It's like making "gold BRICS", so let's have some statistical fun!
Our data are based on the "pink sheet" of the World Bank, for commodity prices and price indices, and on the monthly dollar-pound exchange rate from FRED (all data are monthly, the exchange rate is computed as the intra-month average of daily quotes). We use the following variables: [math] a_{t}[/math] is the agricultural price index, [math] e_{t}[/math] is the energy price index, [math] m_{t}[/math] is the metals and minerals price index, [math] p_{t}[/math] is the precious metals price index, [math] g_{t}[/math] is the price of gold (in US dollars/troy oz) and [math] s_{t}[/math] is the (inverse of) US/UK exchange rate. We rescale the prices indices [math] (a_{t}, e_{t}, m_{t}, p_{t})[/math] to take the value of 1 at the beginning of each sample.
We construct two "indices" of exchange rates that are similar in their temporal evolution but different in the variables they have: the first index is very simple, we call it and is defined simply as the ratio of energy prices to gold price, i.e.,
[math] i_{t}^{*} \doteq (e_{t}/g_{t})\times 12[/math]
This index is the amount of energy, valued in gold, that one can buy with a one dollar - so by flipping the units of measurement (on the division by gold prices) we have created a gold-valued, energy-based exchange rate with reference to the dollar. The second index, [math] i_{t}[/math], takes into account all commodity prices and is defined as:
[math] i_{t} \doteq \left[(a_{t}+e_{t}+m_{t}+p_{t})/g_{t}\right]\times \frac{12}{4}[/math]
which is defined as the ratio of the average commodity price of agriculture, energy, metals and minerals and precious metals to gold price, expressed as the commodity basket, valued in gold, that one can buy with one dollar. In both these new indices we have a commodity (energy) or a basket of commodities valued in gold and referenced to the dollar. So, one can actually make easy comparisons on the value of goods, different than gold, in gold and dollars: [math] i_{t}^{*}[/math] and [math] i_{t}[/math] are our "gold bricks"! But by what measure might these indices be deemed useful? Here goes the exchange rate - and our use of the pound is only because it has a much longer history that the euro. As the two indices are expressed in terms of weight in gold they should be anti-correlated with a pair like the pound-dollar exchange rate (remember that we have expressed the rate as the number of pounds one can buy with one dollar, so comparisons are on the same scale). Let us explore a bit this relationship by looking at some correlations over different periods, in Table 1 below:

Table 1. correlations of gold BRICS vs. the dollar-pound exchange rate
The results of Table 1 clearly suggest the anti-correlated nature of the two new indices with the pound-dollar exchange rate, especially after the 1990's. Both indices have negative correlations of more than medium magnitude, and after the 1990's these correlations are averaging more than 60% to 65%. Figure 1 below shows the evolution of the two indices and the pound-dollar exchange rate from 1990 onwards.
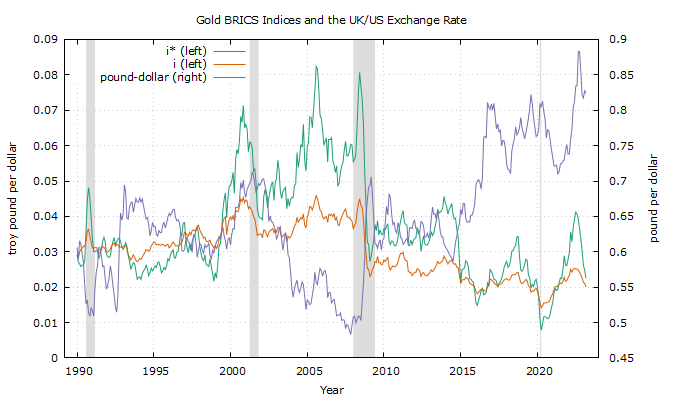
Figure 1. [math] i_{t}^{*}[/math] and [math] i_{t}[/math] indices and the pound-dollar exchange rate
One critical question that the reader might ask is this: how much does our play-currency, our "gold bricks", differ from just using the price of gold itself? A suggestive answer can be given if we attempt a pseudo-trading exercise using our two new indices to trade the pound-dollar exchange rate. The idea is very simple. Define our trading strategies as in:
[math] r_{t+1}^{*} \doteq -sgn\left[\Delta \log (i_{t}^{*})\right]\times \Delta \log(s_{t+1})[/math]
when using the [math] i_{t}[/math] index. That is, we will use the anticorrelation property to trade the pound-dollar return using the (negative of the) sign of the index return. For comparison purposes when using gold price returns for the trading signal, we also define the series [math] r_{t+1}^{g} \doteq -sgn\left[\Delta \log (g_{t})\right]\times \Delta \log(s_{t+1})[/math]. Figure 2 below has the cumulative trading returns from 1990.
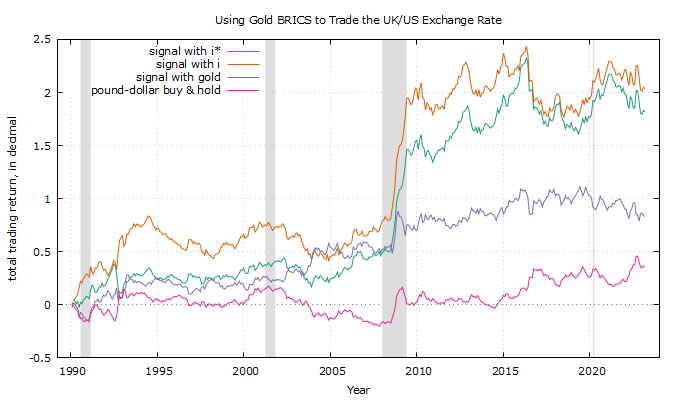
Figure 2. trading the pound-dollar exchange rate with the [math] i_{t}^{*}[/math] and [math] i_{t}[/math] indices
The results are very suggestive and, potentially, of practical significance. What we can clearly see is that the use of the two indices as trading signals gives a refreshingly good trading return, compared to both the trading return when using gold for the signal and to the trading return of passively holding the pound-dollar exchange rate.
So, there you have our play-currency: gold BRICS! We hope that you will find this article interesting and stimulating for more discussion on the importance of commodities in understanding contemporary market moves and foreign exchange fluctuations. Thoughts and comments most welcomed!