


By A. Samitas and I. Kampouris
— Machine learning is a subset of Artificial Intelligence (A.I.) in the field of computer science that often uses statistical techniques to give the model the ability to "learn" with data without being explicitly programmed. Machine Learning tasks are typically classified into two broad categories: the “Supervised learning” where the model is presented with example inputs and their desired outputs, given by a "teacher", and the goal is to learn a general rule that maps inputs to outputs, and the “Unsupervised learning” where no labels are given to the learning algorithm, leaving it on its own to find structure in its input. Unsupervised learning can be a goal in itself (discovering hidden patterns in data) or a means to an end (feature learning). Other categorizations of machine learning tasks consider the desired output of a machine-learned system: classification, regression and clustering. In classification, inputs are divided into two or more classes, and the learner must produce a model that assigns unseen inputs to one or more (multi-label classification) of these classes. In regression, also a supervised problem, the outputs are continuous rather than discrete. Lastly, in clustering, a set of inputs is be divided into groups. Unlike in classification, the groups are not known beforehand, making this typically an unsupervised task.
Recent development in econometrics and A.I. introduced modern techniques such as Machine Learning and Deep Learning in a form of ‘Early Warning Systems’ (EWS). Our ongoing contribution fells into the field of ‘Early Warning Systems’ (EWS). In doing so, we combine network analysis, multivariate dynamic conditional correlation models, typical ARIMA and GARCH models, portfolio optimization and machine learning algorithms to create accurate methods for predicting the vulnerable periods of contagion during shock events and crisis periods in stock exchange markets, but also to provide valuable information to investors and policy makers about optimum portfolios and how they can best allocate their assets. Currently we have three major contributions in the field that fell into the framework of 1) network analysis and dynamic conditional correlations with machine learning algorithms to predict the possible contagion risk into the “constructed financial” network, 2) energy prices prediction using uncertainty indices and regression learner algorithms along with deep learning, and 3) predicting stock market prices with deep learning and portfolio optimization.
Our first effort studies the ‘‘Early Warning Systems’’ (EWS) by investigating possible contagion risks, based on structured financial networks. Early warning indicators improve standard crisis prediction models performance. Using network analysis and machine learning algorithms we find evidence of contagion risk on the dates where we observe significant increase in correlations and centralities. The effectiveness of machine learning reached 98.8 %, making the predictions extremely accurate. The model provides significant information to policymakers and investors about employing the financial network as a useful tool to improve portfolio selection by targeting assets based on centrality. A visual explanation of our model and the hypothesis is depicted in Figure 1. In the learning process the quadratic Support Vector Machines (SVM) proved to be the most accurate of all other variants. SVMs are supervised learning models with associated learning algorithms that analyze data used for classification and regression analysis. A visual example of how the SVM functions is illustrated in Figure 2.
The results showed that the overall approach was very accurate. In Figure 3 we see the evolution of correlations grouped in geographic regions. As we can see, in the case of stock indices, an instant increase in correlations is related to financial crisis across the time. The results of the contagion risk specification inside the dynamic networks of stocks are presented in the upper subfigure of Figure 4. Our hypothesis was correct, as the results verify the presence of contagion risk for the dates where we observe a significant increase in the correlations (global interdependence) and centralities (vertical red lines). The lower subfigure of Figures 4 present the empirical results of the machine learning approach to predict and forecast the risk of contagion inside the
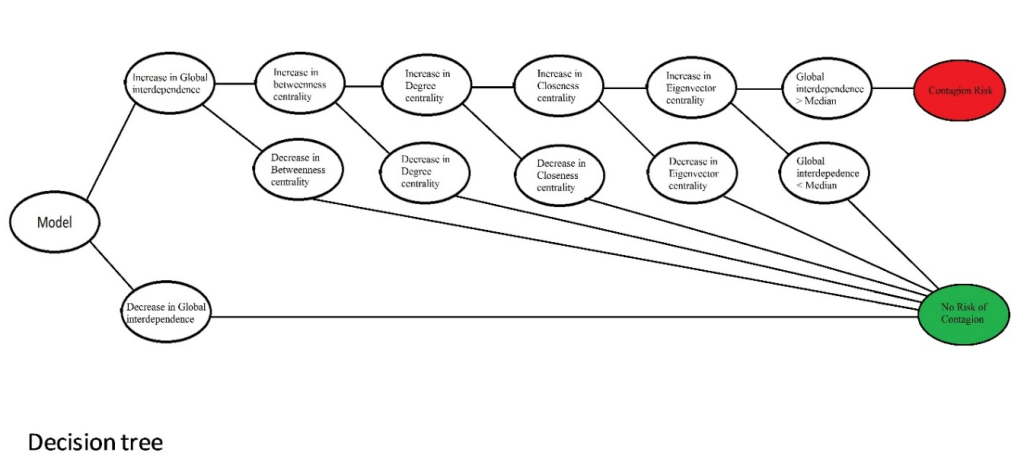
Figure 1. Contagion Risk specification

Figure 2. Hyperplane of Support Vector Machine
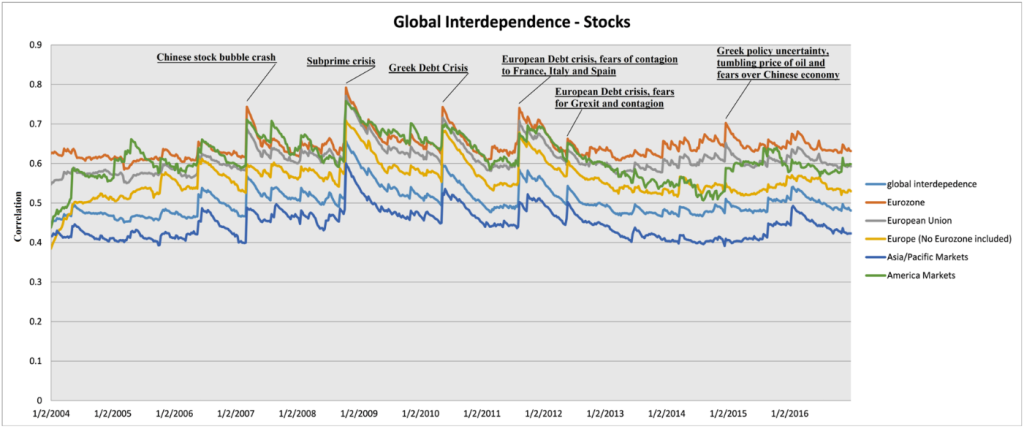
Figure 3. Global Interdependence – Stock indices
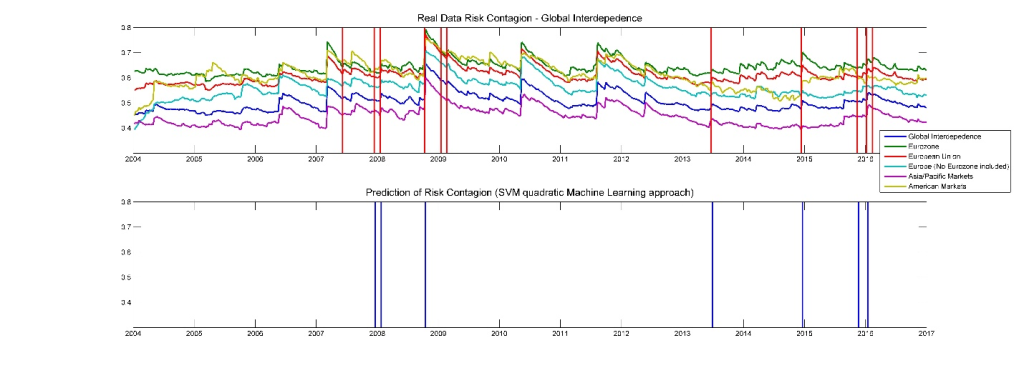
Figure 4. Contagion Risk Specification and Prediction
Our second study analyzes the prediction capability of Machine and Deep Learning models compared to conventional approaches such as Multiple Linear Regression (MLR). Given the uncertainty of the COVID-19 pandemic, and the severe impact on energy sector, we contribute to the literature by deploying Machine Learning (ML) models to forecast energy equity prices by employing uncertainty indices as a proxy for predicting energy market volatility. The study is based on daily data from 1/6/2011 to 18/1/2022 for four US uncertainty and eight energy equity indices. Results show that Neural Networks (NN) and specifically the Nonlinear Autoregressive with External (Exogenous) parameters (NARX) scored significantly better accuracy than all other (25) ML models and conventional approaches (MLR). Figure 5 shows the prediction capability of the models included in the study. We conclude that most of the machine learning approaches outperform the MLR method. The study outcomes are beneficial for policymakers, governments, market regulators, investors, hedge and mutual funds, and corporations. They improve stakeholders’ resilience to exogenous shocks, blaze the recovery path, and provide evidence-based for assets allocation strategies.
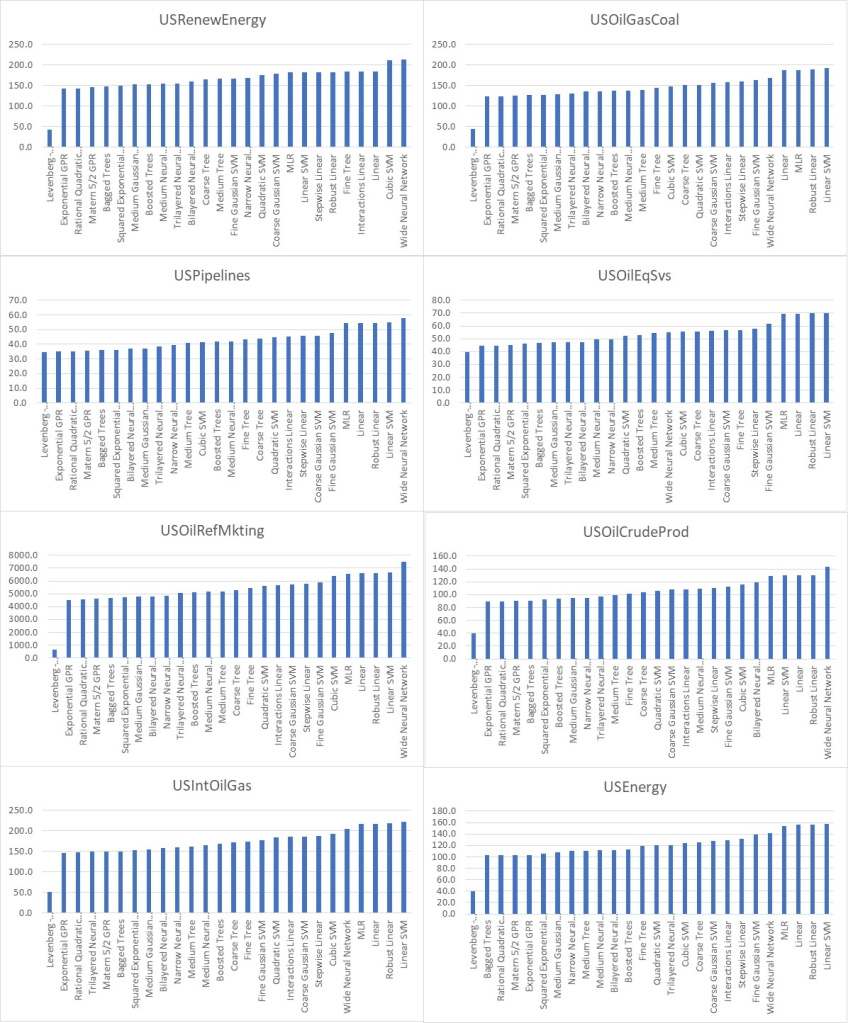
Figure 5. Rankings of RMSE for all forecasting models – COVID-19 pandemic period
Lastly, on our third study, we focused on stock price forecasting and portfolio optimization. The aim of this approach is to investigate the use of Deep Learning not only in predicting stock prices but also in the optimization of portfolios. We compare two methodologies in predicting time series, the classic (ARIMA) and the Long Short-Term Memory (LSTM) from the family of Deep learning and time series forecasting. Having created a diversified portfolio constructed by 176 large-cap stocks from the 20 largest stock markets, we check the ability of accurate prediction for the cases of 30-day, 60-day and 90-day forecast of the two approaches. Then we applied the predictions of the two models to the configuration of optimal portfolios using the Markowitz mean–variance (MV) model. The results of the forecasts from both models as well as the configuration of the portfolios indicate the superiority of LSTM over ARIMA at the respective time intervals. Therefore, this paper can assist investors to build LSTM closing price predictions with MV allocation for mid-term period investment. Figure 6 shows the efficient frontier with max Sharpe ratio portfolio in our analysis using forecasted observations of LSTM model.
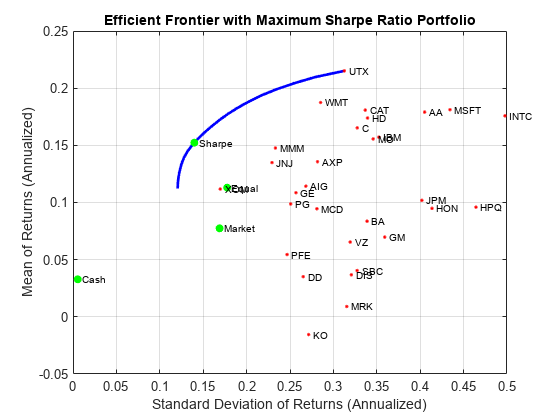
Figure 6. Rankings of RMSE for all forecasting models – COVID-19 pandemic period
As we can observe from the three studies, the machine learning models can be very accurate and, in many cases, the outperform conventional approaches that till now were solved with advanced econometrics. The prediction capability of the A.I. can be a significant milestone in the field of financial technology (FinTech) since it opens new doors and decreases the costs in the forecasting process.
References