By D. Thomakos
One of the most powerful uses of large language models and AI engines is as creativity enhancers. No idea is too wild that it cannot get at least a head-start through a few (well-defined) prompts. This post is another example of such an interaction of ideas and the machine (check the three previous posts for more similar examples). In this post, however, I go beyond the ordinary in exploring quantitative trading strategies and enter the realm of ancient wisdom and divination: I enter to the Book of Changes, the I Ching. An ancient Chinese text on the 64 hexagrams that are the square of the 8 trigrams that form the Bagua, the 8 trigrams. While the description of the cultural complexities of the Bagua and the I Ching are beyond the scope of this post, it is worthwhile noting that they form a significant part of Chinese philosophy and there are many aspects of them that can relate to the pre- and post-Socratic Greek philosophy (a subject that I explore further in my classes on classical management). But what is the I Ching to us, in terms of financial forecasting? It can be many things, depending on your approach to understanding the nuances of forecasting and the concepts of predictability. In this post I will focus on the idea of using the context and elements that form the 64 hexagrams and link them to the quantitative information of financial returns - and no, it ain't financial astrology at work here! What we will see is a concept that we previously explored in the blog: even randomness can be harnessed for the purposes of market timing.
The bulk of the present work was made through DeepSeek and Perplexity, whose answers I have integrated into a usable whole. A critical reminder is that without human intervention and human intelligence we cannot yet produce fully usable code and results based on our prompts alone. But the main bulk of the code is made through the machine, which leaves a lot of room for maneuvering for details in implementation. Having said this, let us get down to what I have done for the I Ching Trader. The first thing was to create an interpretable dictionary of the meanings of the hexagrams. The dictionary contains the fields "name", "action", "confidence", "regime", "element" and "comment". Each day’s market state, derived from six financial features (momentum, volatility, skewness, kurtosis, utility and max drawdown)-is mapped to one of these 64 I Ching hexagrams. This mapping acts as a regime classifier, transforming complex market data into a symbolic state with rich interpretive and actionable meaning.
1. The name field connects each hexagram to its traditional I Ching interpretation, providing a bridge between ancient wisdom and modern quantitative analysis; for example: “Creative Heaven” (Hexagram 1) signals a period of strong upward force, aligning with bullish market conditions.
2. The action value is our core trading signal. It is a continuous value in [-1, 1], where positive values (e.g., 1.0) indicate a long (buy) bias, negative values (e.g., -0.7) indicate a short (sell) bias and values near zero (e.g., 0.0) suggest neutrality or no position. This allows for automatic position sizing: the magnitude of action determines how aggressively the trading engine enters a position. For example: Hexagram 1 (“Creative Heaven”) with action=1.0 means full long exposure, while Hexagram 23 (“Splitting Apart”) with action=-0.85 means strong short or risk-off.
3. The confidence field (1) quantifies the conviction behind the signal: high confidence (e.g., 0.95) suggests the pattern is robust and the signal should be trusted, while on the other hand low confidence (e.g., 0.4) indicates uncertainty or choppiness. One can use confidence to modulate position size as in position size=action×confidence. This helps the strategy adapt exposure to market clarity.
4. The regime label classifies the market context implied by the hexagram: bull, bear, breakout, correction, momentum, reversal, bubble, etc. This supports both quantitative regime switching and qualitative analysis. For example: Hexagram 14 (“Great Possession”) is a bull regime, while Hexagram 28 (“Great Excess”) is a bubble regime.
5. The element (e.g., metal, earth, fire, water, wind, thunder, mountain, lake, wood) is drawn from I Ching cosmology. This primarily interpretive, subjective, it can be mapped to asset classes, sectors, or risk archetypes for advanced strategies (e.g., “fire” for high momentum, “earth” for stability).
6. The comment provides a plain-language rationale for the signal, making the system transparent and interpretable. For example: “Heightened volatility - hedge positions” for Hexagram 6 (“Conflict”).
These properties of the classification of the hexagrams lead to a number of properties for a trading strategy. For example, one can think of the following:
Dynamic Positioning: The combination of action and confidence allows the engine to scale risk up or down, not just flip between buy/sell/hold.
Context-Awareness: The regime and element fields let you analyze performance by market type, spot regime changes, and potentially cluster signals for portfolio construction.
Interpretability: By logging not just the signal but also the hexagram name, comment, and context, the strategy produces a narrative trading log-each trade has a “reason” rooted in both quantitative data and symbolic meaning.
Risk Management: Hexagrams associated with crisis, collapse, or contraction (action negative, confidence high) prompt the engine to de-risk or short, while those with expansion, breakout, or abundance (action positive, confidence high) prompt aggressive risk-on behavior.
Adaptability: Hexagrams with low confidence or neutral action (e.g., “Youthful Folly”, “Contemplation”, “Wanderer”) tell the engine to stay flat or lightly invested, avoiding whipsaw in unclear markets.
Systematic Regime Detection: The hexagram mapping acts as a compact, interpretable regime detector, blending multiple features into a single symbolic state.
Explainability: Every decision is traceable to a named archetype, regime, and comment, supporting both backtesting and live trading review.
Flexibility: You can adjust the dictionary over time, refining meanings as you learn more about which hexagrams best predict profitable or risky conditions.
Let us explore now the methodology in more detail. I start with the feature extraction part, using rolling statistics. Given the time series of prices and returns [math] (p_{t},r_{t})[/math] for an asset, I compute six rolling features over a window of length [math]w[/math], with an optional delay [math]\delta[/math]. These are the following:
Momentum: [math]M_{t-\delta} = \prod_{i=1}^{w} (1 + r_{t-i+1-\delta}) - 1[/math], where [math]r_t = \Delta P_t/P_{t-1}[/math]
Volatility: [math]V_{t-\delta} = \mathrm{StdDev}(r_{t-w+1-\delta}, ..., r_{t-\delta})[/math]
Skewness: [math]S_{t-\delta} = \mathrm{Skew}(r_{t-w+1-\delta}, ..., r_{t-\delta})[/math]
Kurtosis: [math]K_{t-\delta} = \mathrm{Kurt}(r_{t-w+1-\delta}, ..., r_{t-\delta})[/math]
Utility: [math] U_{t} = \mathrm{Average}(r_{t-w+1-\delta},...,r_{t-\delta}) - \gamma\cdot \mathrm{StdDev}(r_{t-w+1-\delta},...,r_{t-\delta})^{2}[/math], where [math]\gamma[/math] is the risk aversion coefficient
Maximum Drawdown: [math]D_{t-\delta} = \max_{k \in [t-w+1-\delta, t-\delta]} \left(1 - \frac{p_k}{\max_{j \leq k} p_j}\right)[/math]
Each feature is binarized by comparing it to its historical median value [math] Md_{t-\delta} = \mathrm{Median}(r_{t-w+1-\delta},...,r_{t-\delta})[/math] over the rolling window (so there is no forward-looking bias here) - but clearly one can find other ways of achieving the digitization we want. For all features, except maximum drawdown, assign 1 if the feature is above its median, 0 otherwise; for maximum drawdown, assign 1 if below its median (less risk), 0 otherwise. Let now [math]b_{t-\delta,1}, ..., b_{t-\delta,6}[/math] be the resulting bits for (momentum, volatility, skewness, kurtosis, cumulative return, max drawdown), respectively. The hexagram index [math]h_{t-\delta}[/math] for day [math]t[/math] is then given by:
[math] h_{t-\delta} = 1 + \sum_{i=1}^{6} b_{t-\delta,i} \cdot 2^{i-1} [/math]
The binary mapping of features to hexagrams is analogous to a cellular automaton or a nonlinear regime-switching process. The 64 hexagrams serve as a compact state space for market regime classification, with each state encoding a unique combination of financial conditions. The hexagram lines are ordered from bottom (momentum) to top (max drawdown), consistent with I Ching tradition. Each hexagram [math]h_{t-\delta}[/math] is mapped to the set of trading metadata via our refined dictionary.
Finally, on each [math]t[/math], we look up in the dictionary to obtain [math]a_{h_{t-\delta}}[/math], the action, and [math]c_{h_{t-\delta}}[/math], the confidence, and form the trading position [math]s_t[/math] as [math]s_{t} = a_{h_{t-\delta}}[/math], or alternatively as [math] s_{t} = a_{h_{t-\delta}}c_{h_{t-\delta}}[/math], or even more aggressively as [math] s_{t} = sng(a_{h_{t-\delta}})[/math]. Here [math]s_t = 1[/math] is fully long, [math]s_t = -1[/math] is fully short, [math]s_t = 0[/math] is flat, and intermediate values represent fractional exposure (unless we take the sign as noted). The strategy's returns are then given by [math] r_{t+1}^{h} = s_{t-d}\cdot r_{t+1}[/math] where [math]d [/math] is an added layer of potential delay.
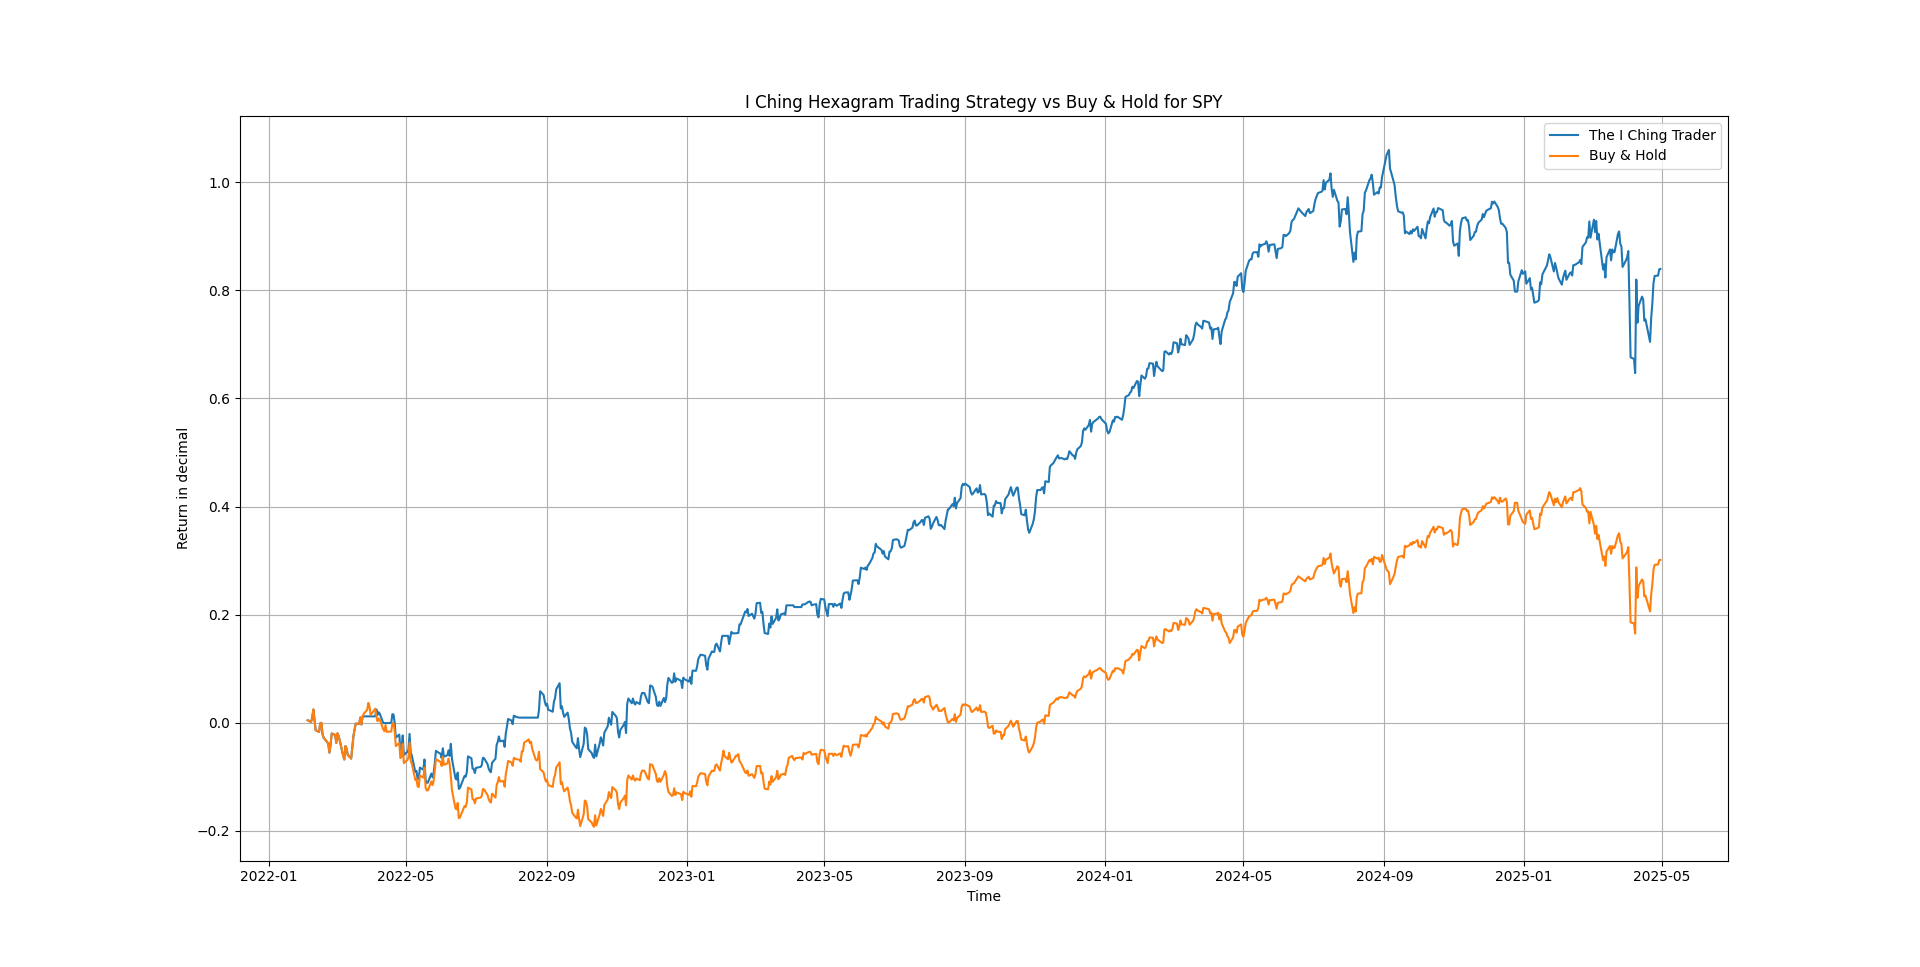
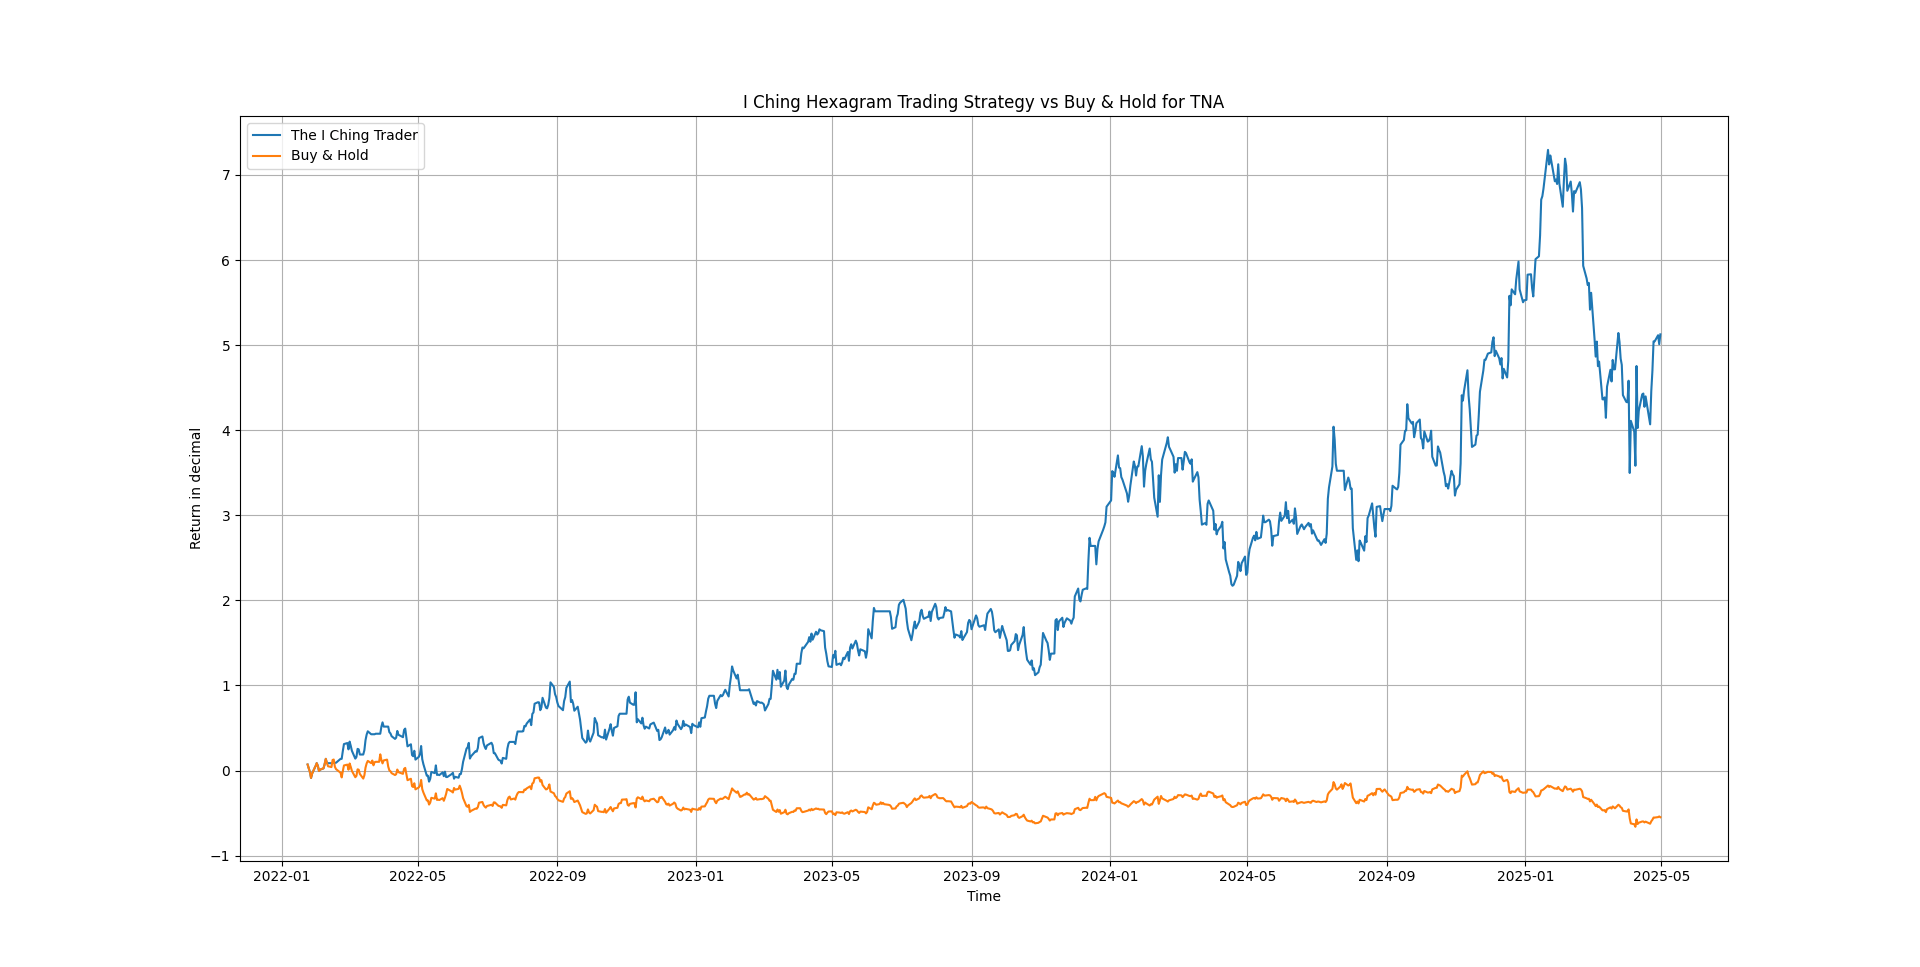
Python code for all the above can be found in my github repository - there are two files and in one of them a machine learning application can be found, tested and altered at will (don't miss it). The code is rather dense, and you should read it to see the wealth of options it has for formulating your own application of the I Ching trader strategy. I shall give some illustrative results below for daily trading from 2022, as we have done many times in past posts. Check the code for replicating the figures below and experiment on your own. The second graph has TNA, a leveraged ETF with very high volatility. The figure speaks of itself, and check the caption to see the details on the parametrization.
That's it. A combination of modern AI technology and ancient Chinese wisdom to blend the best of past and present. Get inspired and explore the 64 paths of speculative profits!

Figure 1. The cumulative return of the I Ching Hexagram strategy; daily returns for SPY from 2022, rolling window is 21 days, risk aversion is 0.5, delays are (1, 0) and the sign is used in the action component to get the trading position. The annualized Sharpe ratio of the strategy is 1.10.

Figure 2. The cumulative return of the I Ching Hexagram strategy; daily returns for TNA from 2022, rolling window is 11 days, risk aversion is 0.5, delays are (1, 1) and the sign is used in the action component to get the trading position. The annualized Sharpe ratio of the strategy is 1.15.


