


By D. Thomakos
It has been quite some time that I have not posted a trading strategy and here is a comeback with a bang! No, nothing too explosive here - on the contrary, a strategy that will wet your appetite for risk taking because it mitigates risk in trading, as we shall see. But first the story behind the strategy.
I have been exploring different AI/LLM engines and was experimenting with Perplexity.AI, a visually aesthetic engine with access to many LLMs. I thought that for this project I would go with something completely off-the-books and start building the first idea that came to my mind; so, I did. The strategy was really simple, and I called it the 5-7-5 strategy: if the past 5 returns were positive then buy, if the past 7 returns were positive then sell and if the past 5 returns were negative and the previous 5+7 returns were positive then buy again. Makes sense?! Probably not, but the evolution of the interaction with the machine changed that! As I was building the code prompt by prompt, I thought that restricting things on the 5-7-5 scale was not necessary: let these be parameters of the form A-B-C, and let the machine figure out how to use them exactly. To make a (possibly boring!) long story short, here is what the final outcome of the mathematics came finally to be (and yes, the math was tackled immediately by the machine).
The strategy is based on three key parameters: [math]\alpha[/math], [math]\beta[/math], and [math]\gamma[/math], which represent the number of past returns to check for buying, selling, and re-entry, respectively. The trading rule can be expressed as follows:
**Buy Signal**: A buy signal is generated when the last [math]\alpha[/math] returns are positive. This can be represented as: [math]B_t = \mathbb{I}\left(\bigcap_{k=1}^{\alpha} R_{t-k} > 0\right)[/math], where [math]R_{t-k}[/math] is the return at time [math]t-k[/math], and [math]\mathbb{I}(\cdot)[/math] is the indicator function.
**Sell Signal**: A sell signal is generated when the last [math]\beta[/math] returns are positive. This is represented as: [math]S_t = -\mathbb{I}\left(\bigcap_{k=1}^{\beta} R_{t-k} > 0\right)[/math]
**Re-entry Signal**: The strategy allows for re-entry when the last [math]\alpha[/math] returns are negative but the past [math]\gamma[/math] returns include at least one positive return. This condition is expressed as:[math]E_t=\mathbb{I}\left[\left(\bigcap_{k=1}^{\alpha} R_{t-k} < 0\right) \cap \left(\bigcup_{k=1}^{\gamma} R_{t-k} > 0\right)\right][/math]
**Final Position**: The final trading position at time [math]t[/math] is determined by combining the buy, sell, and re-entry signals with a delay [math]d[/math]: [math]\Phi_t = \left(B_{t-d} + E_{t-d} + S_{t-d}\right) \in \{-1, 0, 1\}[/math]
That's it, simple, HI-powered and AI-generated, includes momentum and mean-reversion, allows for parameter optimization and a number of other advancements - which you can easily affect yourselves if you grab the Python code from my github repository. The code gives the option to use exponentially weighted returns and optimizes the smoothing parameter along with all other parameters of the strategy. And does it work you ask? Haha, not only it does but it's going to make you smile on the risk-return rewards. The results below, on some of the usual suspect ETFs and the Bitcoin, monthly from 2000 and daily from 2022 are a good testament to the strategy's promise - and when you experiment yourselves with it you will see that it does not rebalance very frequently, reducing transactions costs and increasing potential, you should really check it out.
A quick look at the results of Table 1 will show you the main characteristics of the strategy: large (more that double in cases) Sharpe ratios compared to the buy-and-hold, small (more than double in cases) maximum drawdowns, most-of-the-time excess cumulative returns (6/7 in the daily attribution, 4/7 in the monthly attribution) and, well, piece of mind by the risk-return rewards (and the low rebalancing frequency). Figure 1 shows the cumulative returns of the daily attribution for SPY - and all these attributes of the strategy are showing. And, as a bonus but only for those that ask, I have code for "walk-forward-optimization" (WFO) ready to roll should you complain about the ex-post optimal results shown below.
AI-assisted and and AI-generated code will hyperboost productivity and creativity and could not be happier for that; grab the code, amend it and learn again the ABCs of speculation!
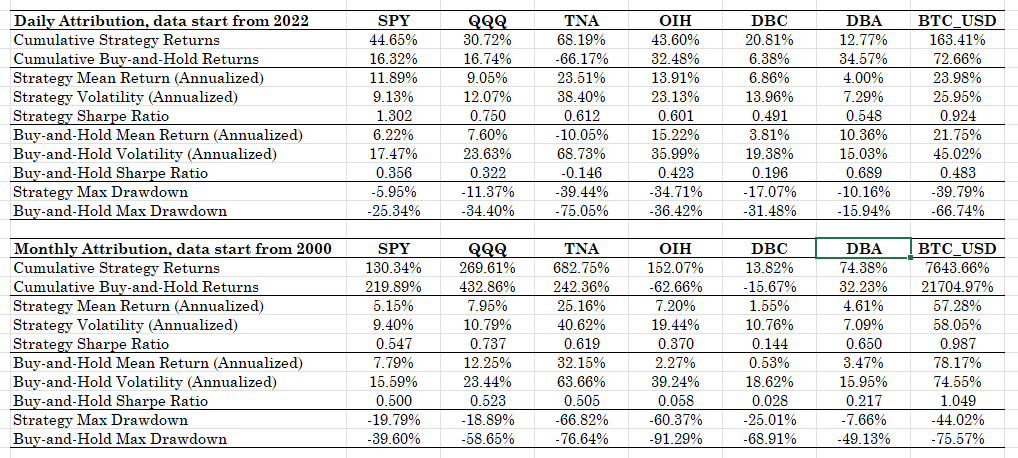
Table 1. Performance attribution of the ABC of Speculation strategy.

Figure 1. The evolution of cumulative returns of the strategy and the buy-and-hold for SPY, daily data from 2022.