By F. Kyriazi
In a stream of previous posts, see for example here and here, we have examined the ability of some simple models to forecast the signs of financial returns for the purpose of trading. In this post we explore another fundamental aspect of the above approach, namely the impact of data digitization.
When forecasting the sign of financial returns we essentially transform the forecasting problem into a digital one, i.e., into a mapping of the continuous forecast into the set of [math] \left\{-1, 1\right\}[/math] or [math] \left\{0, 1\right\}[/math]. So, why not use the data in digitized form instead of their continuous form when generating the forecast itself? We shall show that this digitized approach can lead to potential performance enhancements, so you should consider it in practical applications.
Let [math] y_{t}[/math] denote the monthly returns of the NASDAQ ETF, QQQ, or the monthly returns of the gold ETF, GLD. Then consider the digitized returns [math] z_{t} = \left[I(y_{t} > 0) - I(y_{t} \leq 0)\right][/math] (this formulation has the natural advantage that the threshold for deciding on positive or negative returns is zero). We shall apply two models in the [math] y_{t}[/math] and [math] z_{t}[/math] series as follows:
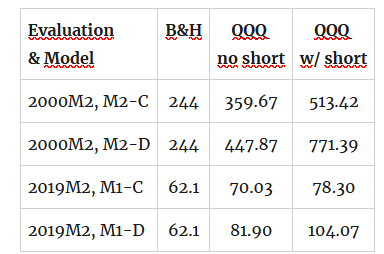
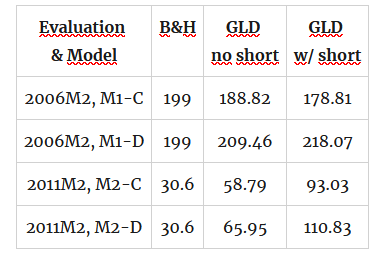
First, the "speculative constant" (M1) model as in [math] y_{t} = \mu + \epsilon_{t}[/math] or [math] z_{t} = \delta + \eta_{t}[/math]; second the "speculative constant plus negative drift" model (M2) as in [math] y_{t} = \mu_{0} + \mu_{1}I(y_{t-1} \leq 0) + \epsilon_{t}[/math] or $latex z_{t} = \delta_{0} + \delta_{1}I(z_{t-1} \leq 0) + \eta_{t}[/math]. The trading rule is the natural one based on the sign of the corresponding forecast. We use a rolling window of $latex R=12$ months and present some illustrative results in Tables 1 and 2 that follows (returns in percent). Note that we use the notation Mi-C or Mi-D for the model using continuous (C) or digitized (D) returns.

Table 1. performance attribution of strategies for QQQ ETF

Table 2. performance attribution of strategies for GLD ETF
As you can see from the tables there is considerable performance improvements that might be gained after the application of the same models as before but using digitized returns. Furthermore, and results are available on request, on further experiments that we have done, we found that the use of digitized returns tends to outperform the use of continuous returns even when the strategies do not outperformed the benchmark.

Figure 1. cumulative returns of the speculative constant model with continuous and digitized returns
So, if you want to go digital you can always ask for the Gretl code!


