By F. Kyriazi
It’s not every day that a data scientist opens a Python script and accidentally channels the spirit of Confucius. And yet, here we are: parsing U.S. macroeconomic indicators, calculating momentum and skewness, and matching them not to standard regression coefficients or PCA components—but to the hexagrams of the I Ching.
If this sounds like financial astrology in disguise, rest assured: no stars were harmed in the making of this model. What we’re working with is a structured, symbolic framework—deeply interpretable, surprisingly coherent—that classifies macroeconomic regimes using a blend of statistics, machine learning, and ancient Chinese philosophy. This work builds directly on the ideas introduced in a previous post, the I-Ching Trader, where Dimitrios Thomakos explored the integration of ancient wisdom and modern AI through the I Ching in the context of financial forecasting. There, he outlined how each of the 64 hexagrams—symbolic representations from classical Chinese thought—can be interpreted as archetypes of financial conditions, assigned using real-world financial data and mapped to directional market signals. The current article expands that concept into a rigorous framework for analyzing macroeconomic variables, introducing a formal data pipeline and drawing insights from rolling historical analysis.
At the heart of this project lies the challenge of translating raw economic data into meaningful signals. Rather than relying solely on traditional regime-switching models or hard-threshold logic, this approach introduces a symbolic framework based on the 64 hexagrams of the I Ching. Each hexagram encodes a specific macroeconomic “state,” determined by a combination of six binary features derived from CPI skewness and volatility, energy price momentum, interest rate volatility, industrial production momentum, and unemployment rate volatility. These features are computed using rolling statistical measures over historical data, then transformed relative to their medians and mapped into binary form. The result is a six-bit signature which, when converted, yields a unique hexagram. Each hexagram serves as a symbolic label assigned to a particular economic configuration. However, these labels are not merely decorative. Each is linked to a structured dictionary of information that includes a directional action signal in the range from -1 to 1, indicating whether the associated market bias is bearish, neutral, or bullish. The confidence score reflects the robustness of that signal, while a qualitative regime label captures the character of the economic environment—such as reform, stability, contraction, or boom. To add another interpretive layer, an elemental archetype from traditional cosmology (earth, wind, fire, thunder, and so forth) is attached, hinting at sectoral or structural tendencies. Lastly, a comment field explains the rationale behind each assignment in clear, economic language. Details can be found in the associated Python code here. Make sure to run the code to see the distribution and timing of the hexagrams discussed below!
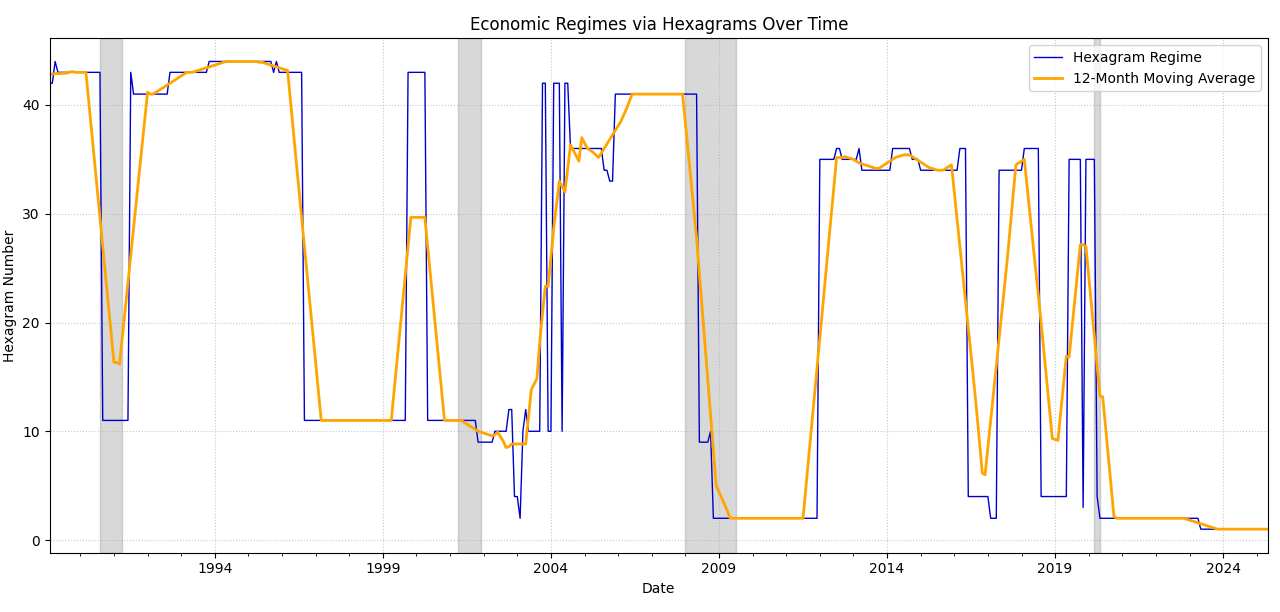
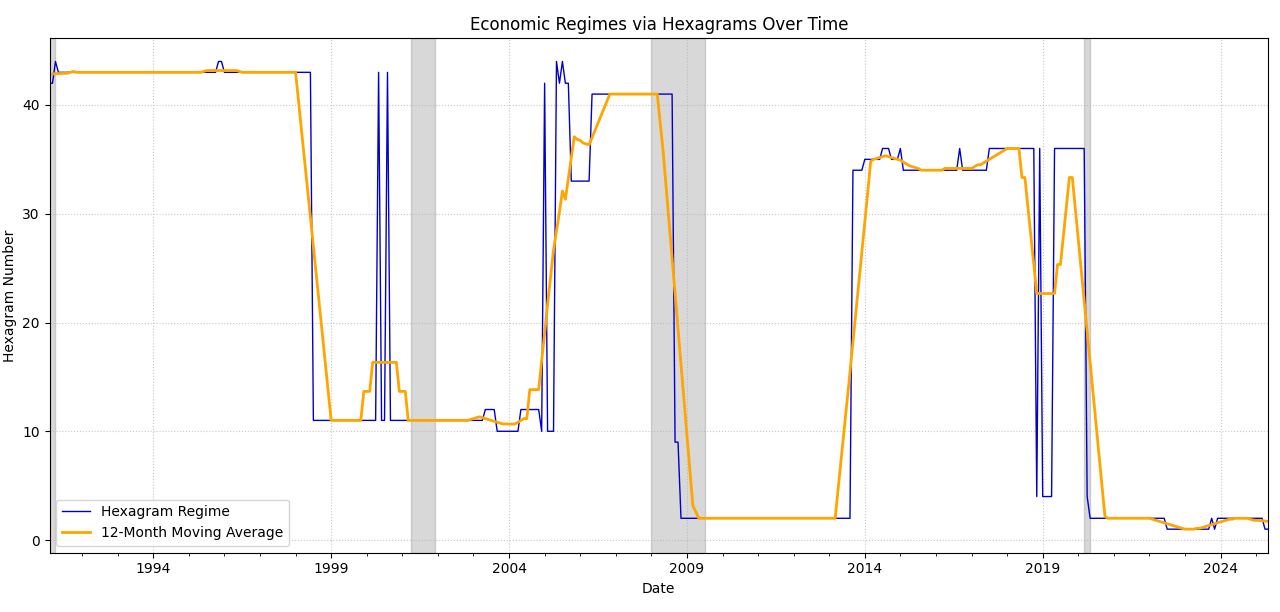
This system transforms the complexity of macroeconomic inputs into interpretable regimes—compressing months of multi-indicator data into discrete symbolic states such as “Peace,” “Breakthrough,” or “Standstill.” These states, in turn, become a lens through which one can understand both present dynamics and historical transitions. To explore how responsive this framework is, the model was applied to two rolling windows: 36 months and 60 months. The 36-month window, shorter and more reactive, captures dynamic transitions with greater frequency. In the data extracted from the 36-month implementation, Hexagram 43, “Breakthrough,” features prominently throughout the early 1990s—a period consistent with reform-driven growth and policy transformation. This shifts dramatically in the post-2008 financial crisis era to Hexagram 2, “Receptive Earth,” a symbolic call for retreat, stabilization, and foundational rebuilding. The years that follow oscillate between signals of cautious optimism and tentative growth, embodied by symbols such as “Treading” and “Small Taming.” The 60-month window, by contrast, produces a more stable portrait of the economy. With a longer memory and slower transitions, it reflects structural economic behavior rather than short-term volatility. In this view, Hexagram 11, “Peace,” dominates much of the late 1990s and early 2000s—a period marked by low unemployment, sustained growth, and international confidence in U.S. monetary leadership. The transition toward stagnation and gridlock becomes evident in the early 2000s through the recurring appearance of Hexagram 12, “Standstill,” suggesting a loss of momentum and emerging policy fatigue. These shifts do not occur suddenly, but through slow symbolic drift—capturing the structural transitions of a maturing economy.
A time series visualization of the hexagram assignments illustrates these symbolic regimes in action. Over decades of U.S. economic life, we observe hexagram sequences overlaying key macroeconomic events and aligning with official recession periods as marked by NBER data. When plotted with a 12-month moving average, the hexagram sequence not only becomes smoother but more predictive. Extended periods where the same hexagram dominates reveal macro-stability—while sharp transitions signal the onset of new regimes. Notably, many of the low-numbered hexagrams appear in periods of stress or recession, while higher-numbered ones are concentrated in phases of expansion and innovation.
This symbolic framework is not just analytically interesting—it is also operationally useful. By mapping current economic data to a hexagram, we can derive a clear action signal and adjust allocation strategies accordingly. Because the system is interpretable, it facilitates communication between technical analysts, policy observers, and decision-makers. A regime like “Darkening of the Light,” with its commentary on opacity and policy confusion, carries far more intuitive power than raw indicators of kurtosis or CPI volatility. And when “Great Possession” or “Breakthrough” appears, stakeholders understand that a strong upward force is at play—even before seeing the numbers. The I Ching Macro Monitor does not intend to replace econometrics or time-series forecasting. Instead, it enhances these methods with symbolic narrative structure - and the narrative can be as powerful, or even more powerful than numbers. It allows us to frame economic transitions as thematic shifts—adding meaning where numbers alone might fail. In an era of overwhelming data, this approach offers interpretive clarity. Each hexagram becomes a regime flag: a signal that encapsulates a point in economic history, a perspective on current conditions, and a hypothesis about what comes next.
This is not about mysticism. It is about structure. And in the I Ching, we find one of the most elegant systems ever devised for navigating structured change. By bringing that system into the language of economic indices, we create a bridge between the oldest wisdom and the newest data. Sometimes, the best way to see the signal—is to give it a symbol.

Figure 1. The I Ching Macro Monitor with a 36-month rolling window and recession dating, US monthly data - for details please see the Python code.

Figure 2. The I Ching Macro Monitor with a 60-month rolling window and recession dating, US monthly data - for details please see the Python code.


