By D. Thomakos
Searching for latent signals of a rising or falling unemployment is like gold prospecting. You have to "dig-in" the data, and this is what I did in the FRED database. The question was this: can I find a combination of higher frequency financial variables that will mirror the evolution of the unemployment rate? It ain't easy if you do this in a non-structured way, this is why it looks like gold prospecting. But I think that I hit a gold spot - let me explain and you will be the judge of the quality of my findings.
If the economy runs on money, then the types of money being used out there should matter - commonplace but true. The two broad measures of money supply M1 and M2 have several components of interest, and my prospecting wanted to consider higher frequency (weekly) variables first. I thus took the currency component in M1 [math] x_{t1} [/math] the retail money market funds component in M2 [math] x_{t2} [/math]. These two components measure different money uses by the public and investors and maybe they can reveal how people think about their monetary liquidity, savings and investment decisions. I take the log-difference between the second minus the first of these components to create the weekly monetary ratio for week s of month t [math] WMR_{s,t} \doteq \log(x_{st,2}/x_{st,1}) [/math] as my high frequency indicator. I then compute the monthly average of its values to convert it into the monthly frequency (that we have for the unemployment rate), i.e., [math] AMR_{t} \doteq 0.25\times \sum_{t-3}^{t}WMR_{s,t} [/math]. It is this monthly average variable [math] AMR_{t} [/math] that I next find its relationship with the unemployment rate [math] U_{t} [/math].
To do this I compute the lagged cross-correlation between the two variables, i.e., I compute [math] \hat{\rho}(U_{t},AMR_{t-d})[/math] for various values of the delay parameter d. The results, identical if I do this computation from 1990 and from 2000, are reported in Figure 1 below -- additional details can always be found in the Python code in my github repository.
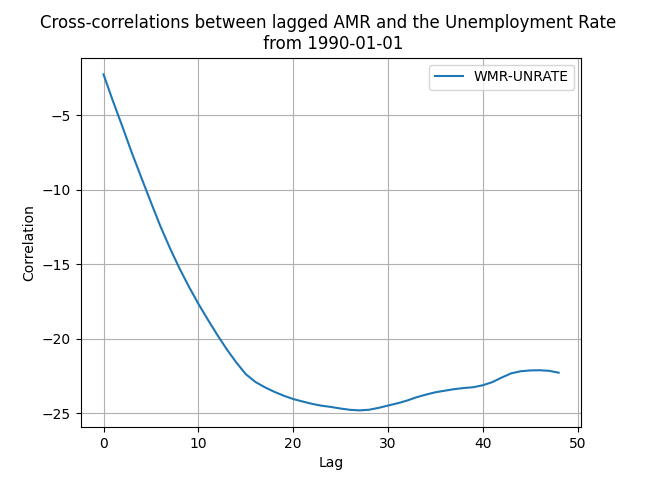
Figure 1. Cross-correlation between lagged AMR and the Unemployment Rate.
As you can see we have a unique value for the maximum absolute correlation around the 24-26 month lag, a two-year period. This is interesting on its own with implications for forecasting - in the code you can experiment more on the starting date and find out how results change, you should do that! The data aligned, with the new indicator moving forward in time are in Figure 2 below.
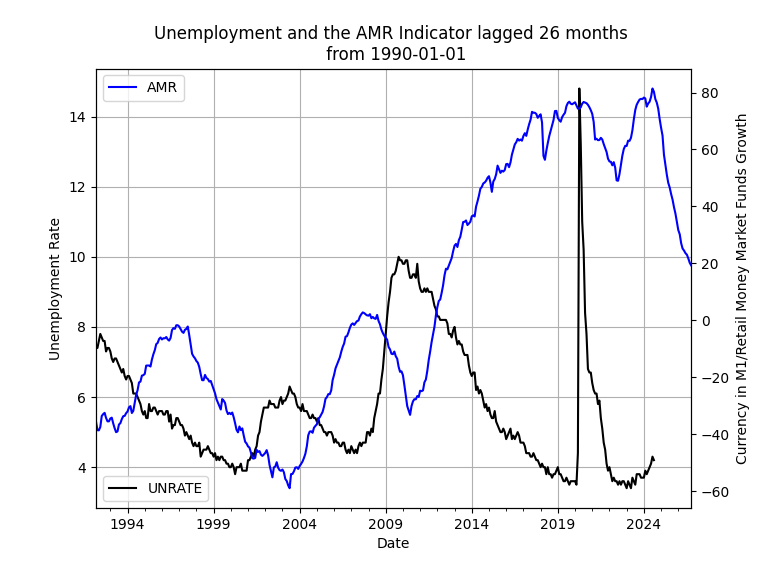
Figure 2. The lagged AMR and the Unemployment Rate.
The mirror image relationship between the AMR and the unemployment rate, consistent from the 1990's to the Covid-19 crisis in 2019, can be clearly seen! It is truly a leading indicator what we have here, seriously leading by a very wide interval. The relationship is not obvious in the post-Covid period, but since the data are aligned one can clearly speculate about the near future (peak?) and far future (turning from local highs to local lows) of unemployment. This is something worth pondering for anyone thinking about macroeconomic conditions in the US economy.
An interesting by-product of finding out this new unemployment proxy is its use for, what else, speculative trading. Here the results are even more informative. For the period before 2019 following the past sign of the AMR itself was sufficient to protect an investor from the crises in the post-2000 period; for the period after 2019 following the past sign of the difference of the AMR would do the trick. In equations, the trading rules where thus as follows:
Before 2019: [math] \hat{r}_{t+1|t}^{AMR} \doteq y_{t+1} \times sgn(ARM_{t-d}) [/math]
After 2019: [math] \hat{r}_{t+1|t}^{AMR} \doteq y_{t+1} \times sgn(-\Delta_{h}ARM_{t-d}) [/math]
Note that for the post-2019 period we have two parameters to consider, (h, d), the order of the difference of our proxy and the delay of the trading signal. Here [math] y_{t+1} [/math] is the monthly return of any asset you will be experimenting with. In Figure 3 below I show some performance results for the SPY, QQQ and TNA ETFs. Not bad of a performance you would say, right?!
There you have it: a financial, high-frequency, proxy, mirror image for the unemployment rate, with sufficient leading indicator properties to possibly be used of practical significance. An added bonus is that appears to be a useful trading signal as well. Get your hands in the code and find out more about the interplay of currency, money market funds and unemployment and create your own forecasts!
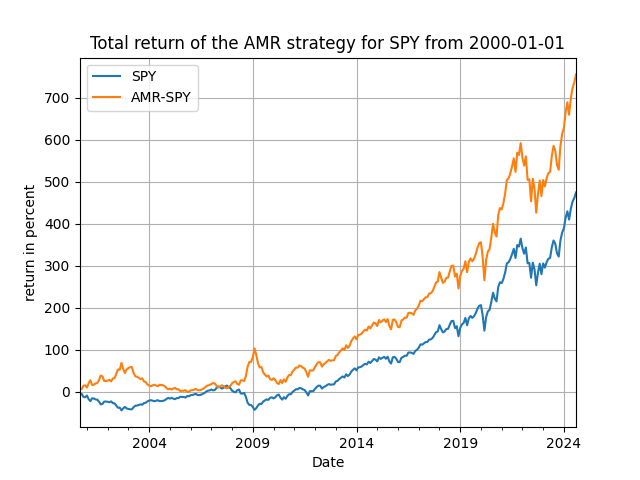
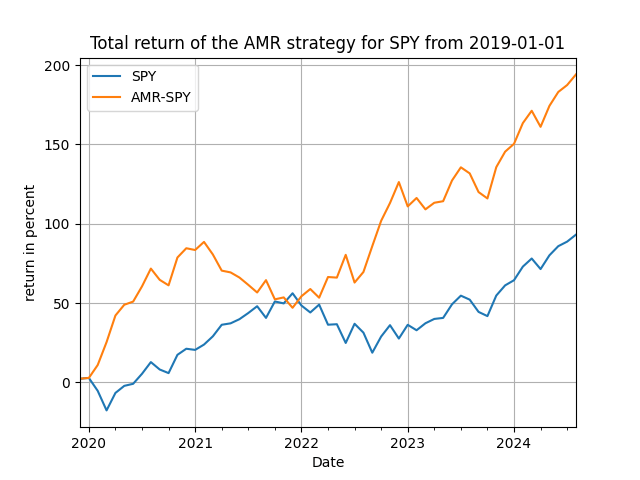
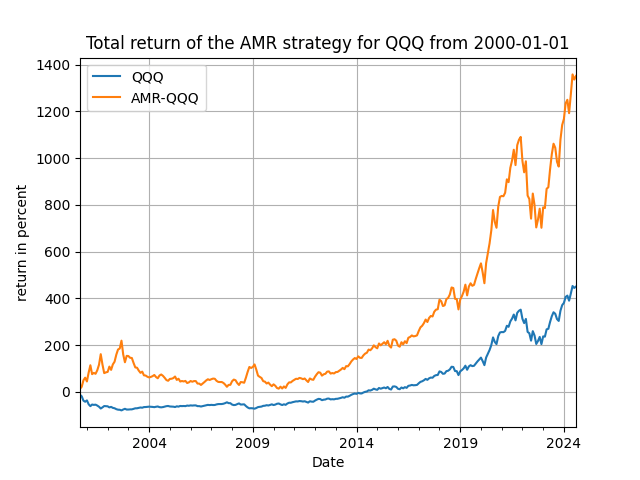
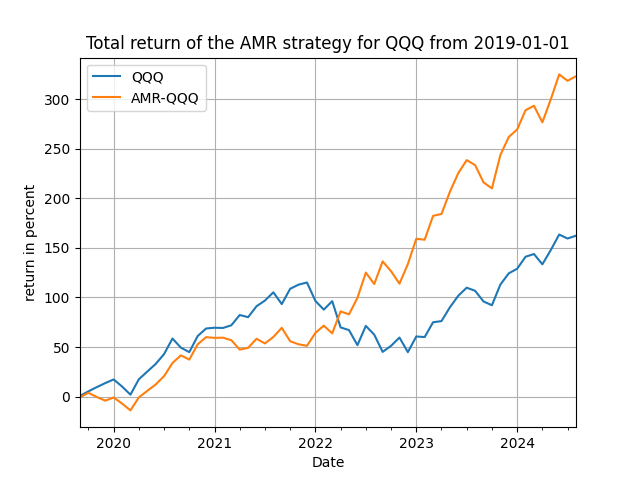
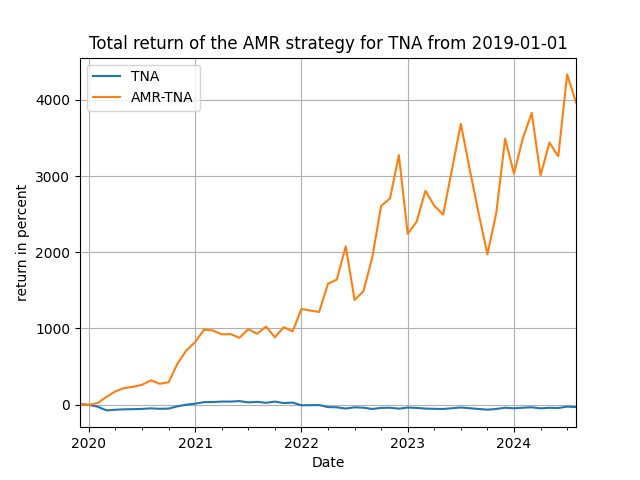
Figure 3. The trading performance of the use of the lagged AMR as a signal variable for SPY, QQQ and TNA - monthly rebalancing.


